It’s a no-brainer that page load times have a direct impact on conversion rates.
Typically on this community I’ve seen Unbounce experts and reps use Pingdom as the benchmark for page load times or they use a browser extension on their local machine (running on what I assume is a superfast office leased line and a fast desktop machine). Those tests are meaningless.
Any page load speed test you do needs to be factor in user location, user bandwidth, and user’s browser (e.g. test mobile).
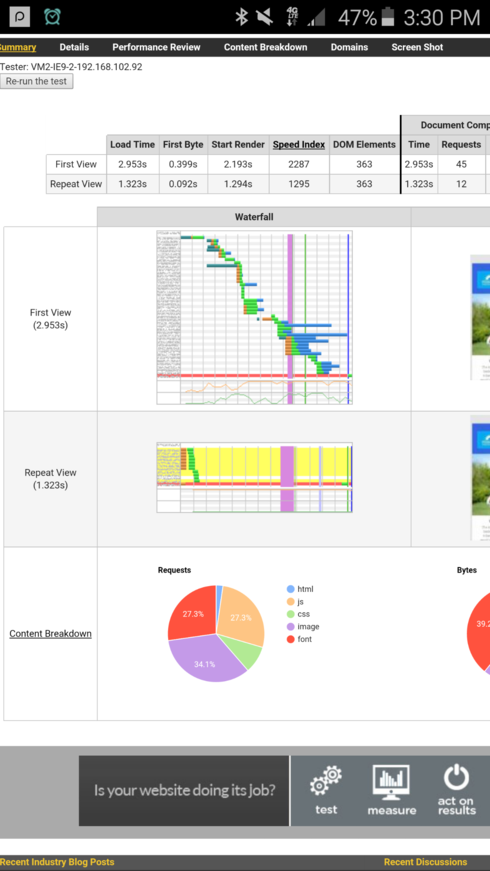
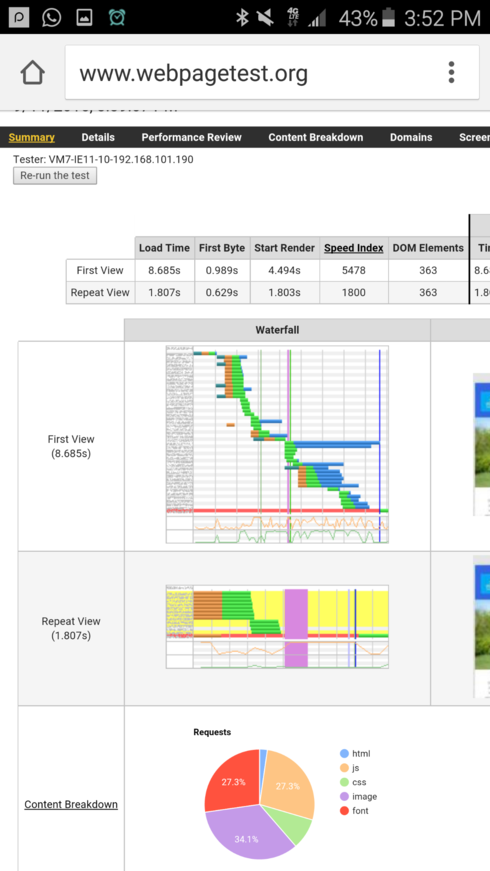
I tested this theory out recently by comparing Pingdom load times to more realistic tests and I was horrified at the performance in simulated real world tests. See the screenshots below. This is all for the same page hosted on Unbounce. These tests were all taken with minutes of each other.
Pingdom:1.32 seconds
vs
GTMetrics: 12.1 seconds
vs
Webpagetest.org: 8.65 seconds
The latter two allow me to specify both the location and download speed for a user and I chose 5 Mbps which is a reasonable benchmark.
For a page size of 200-400 KB + including ALL html, scripts and images, it’s shocking to see such high load times. I can only assume this is because of multiple unnecessary scripts that are loaded and I cannot remove, having scripts in multiple files across different domains, etc. I have no control over these issues because none of these are custom scripts. And I am unable to act on any of the recommendations of these websites because it’s up to Unbounce. Having CDNs deliver images and JS is almost pointless when all the other best practice recommendations are not being met.
What makes it worse is my actual landing page is less than 100 KB including the images and custom scripts I added. Everything else is force loaded by Unbounce and doesn’t affect the page’s functionality or look in any way, as far as I am concerned. E.g. Unbounce support tells me jQuery is needed for Unbounce to function and I don’t understand why because my page doesn’t need it to function. It’s not easy designing a good looking functional page within 50-100 KB fully loaded and it’s incredibly frustrating to see the size double because of force loaded stuff I don’t need or want.
I thought I should share this with the community. If enough people are seeing similar results, maybe someone needs to do something.
***I would suggest everyone test their pages using more accurate conditions right now ** and post their screenshots here. ****Basically at least two websites that let you (i) ****specify **location (ii) simulate download speed, and (iii) simulate a browser version
Finally, a word from a developer I used on some projects. This affects page render times, if not page load times. Both of which impact conversion rates.
"You drag a block of content into position and, behind the scenes, the editor has unnecessarily wrapped that simple block of text in a 10+ layer deep nest of tags. Now your simple
tag which should exist no more than maybe one level deep from the body tag (html > body > main > h1) becomes something like this:
html > body > div#lp-pom-root > div.lp-positioned-content > div#lp-pom-text-187 > h1 > span > span > span > strong > span > span
This is an actual example from one of your pages."


