The conversion rates are showing different numbers (and winning page) than the conversion rate chart at the bottom. How is that?

  • 8 October 2015
  • 2 replies
  • 3 views

I’m monitoring a landing page test, and it shows one set of numbers for both variants at the top of the page, but different numbers in the chart at the bottom (it even shows the other page as leading!). 

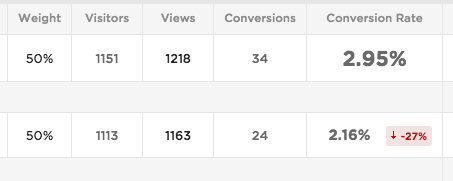
In the table at the top (“AE” first at 2.95%, “AF” second at 2.16%):

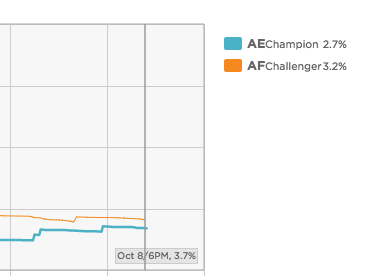
In the chart at the bottom:

Thoughts?


2 replies

Hey Jeff,

AE and AF is the variant.  Each time you create a variant is gives the landing page a sequential id.

My guess would be that the chart at the bottom is looking at that particular date’s conversion rate, rather than the overall conversion rate over time. 

Best,

Joe

The chart shows each variant’s conversion rate for a specific point in time. When you place the “bar” on e.g. Oct 8 at 6pm, it will show the conversion numbers for Oct 8 at 6pm. Try and move the bar around and you will get the point right away. 

The table at the top of the page shows the overall conversion rate for the full test duration. 

When your sample is as small as it is now (58 conversions) even just a few extra conversions on a variant will dramatically impact your numbers. 

Reply