Hey everyone!
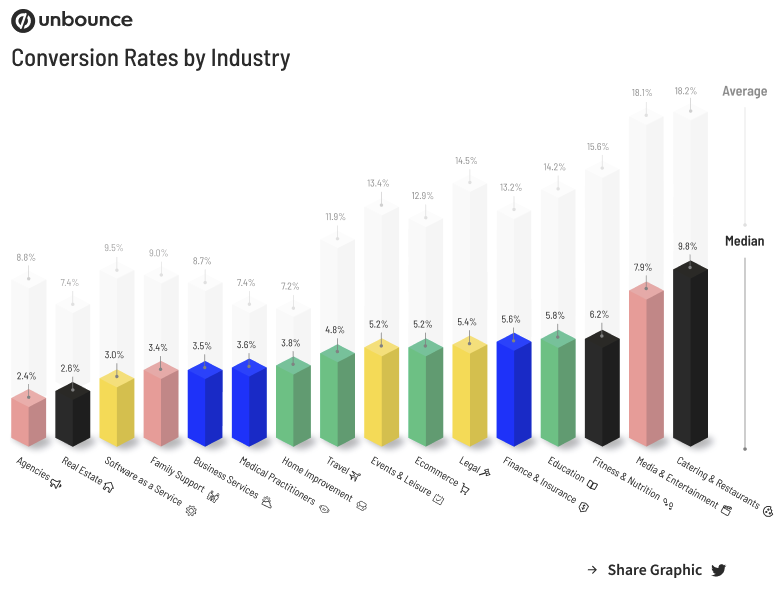
It’s your friendly neighbourhood Community Manager here with the latest report that you can take to your boss (and/or clients) and let ‘em know that you know what a good conversion rate is.
2020 had a big impact on nearly every industry when it comes to digital marketing, so where your industry stood a year ago is likely no longer the case. We’ve used AI to analyze more than 44,000 landing pages and over 33 million conversions, refining a mountain of data into actionable recommendations that make optimization simpler.
When it comes to conversion rates, it’s often hard to know if you’re reaching your conversion potential. That’s where industry benchmarks come in–you’ll be able to see how your landing pages are stacking up against the baseline in your industry (and others).
This report is stacked with insights that you can put to work immediately.
👉 Get The Conversion Benchmark Report Now
We hope you love it!
–Jess & The Unbounce Marketing Team

