Hey everyone 👋🏻
Over the last few months, we’ve made it easier to optimize your campaigns with three new reporting enhancements in the Unbounce dashboard. Take a look!
1️⃣ Industry Benchmarks
Find out how your landing pages stack up against your competitors. This feature analyzes your landing page against the median conversion rate and readability standards for your industry, providing a ranking score (low, medium, high) to identify your best opportunities to improve.
It will also provide suggestions on how to improve your pages, such as increasing or decreasing the word count based on industry-specific best practices.
You can find this feature in the “All Pages” view of your account, or the “Reporting” tab of your landing pages. Check out this article for more info!
2️⃣ Audience Insights
Analyze page performance for specific audience characteristics using Smart Traffic. This feature compares your traffic, conversions, and conversion rates across three visitor attributes:
-
Device type—mobile or desktop
-
Location—country or state/province
-
Operating system—Mac, Windows, iOS, Android, etc.
To inform your next experiment, you can also use the “Active Variants” section to compare these attributes per variant.
Audience Insights requires Smart Traffic enabled on your pages, and you’ll find this information in the “Reporting” tab of your landing page. For more information, take a look at this helpful article.
Watch and learn more about these two powerful features in this 3-minute video from our Product Marketing team:
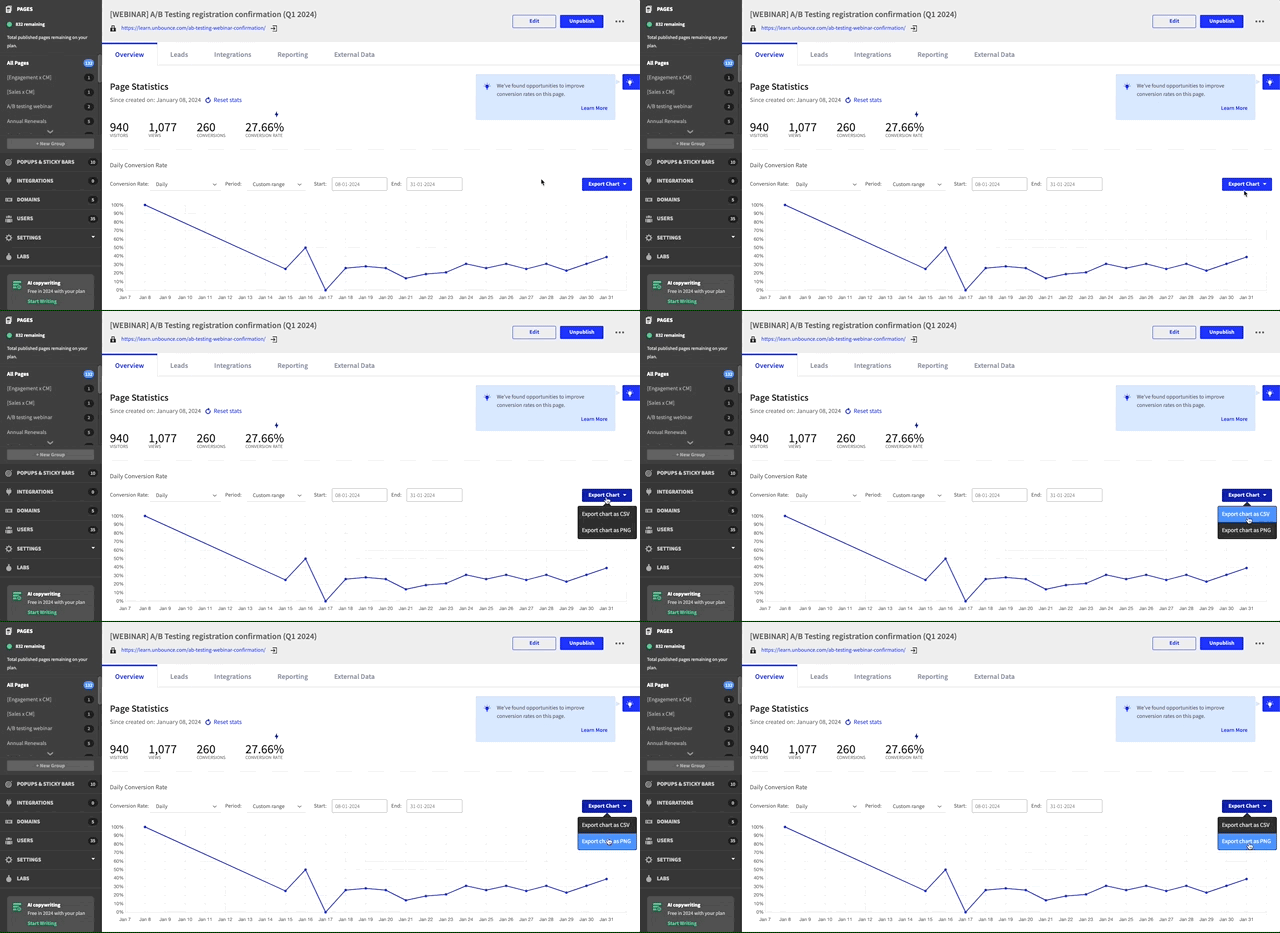
3️⃣ Conversion Chart Export
Export your conversion data straight from your dashboard with one click. You can dive deep into your campaign’s performance or share trends in a presentation by exporting your conversion rate chart as a CSV or PNG file.
From your page overview, customize the information you’d like to include:
-
Conversion rate—choose a daily rate or rolling average
-
Date range—choose a preset range or custom range
-
Pages—choose your overall conversion rate or for specific variants
Once customized, hit the “Export Chart” button to download your preferred format. Get all the details on this feature right here.

Good luck with optimizing your campaigns and let us know what other reporting enhancements you’re interested in! 🚀
