Hello everyone,
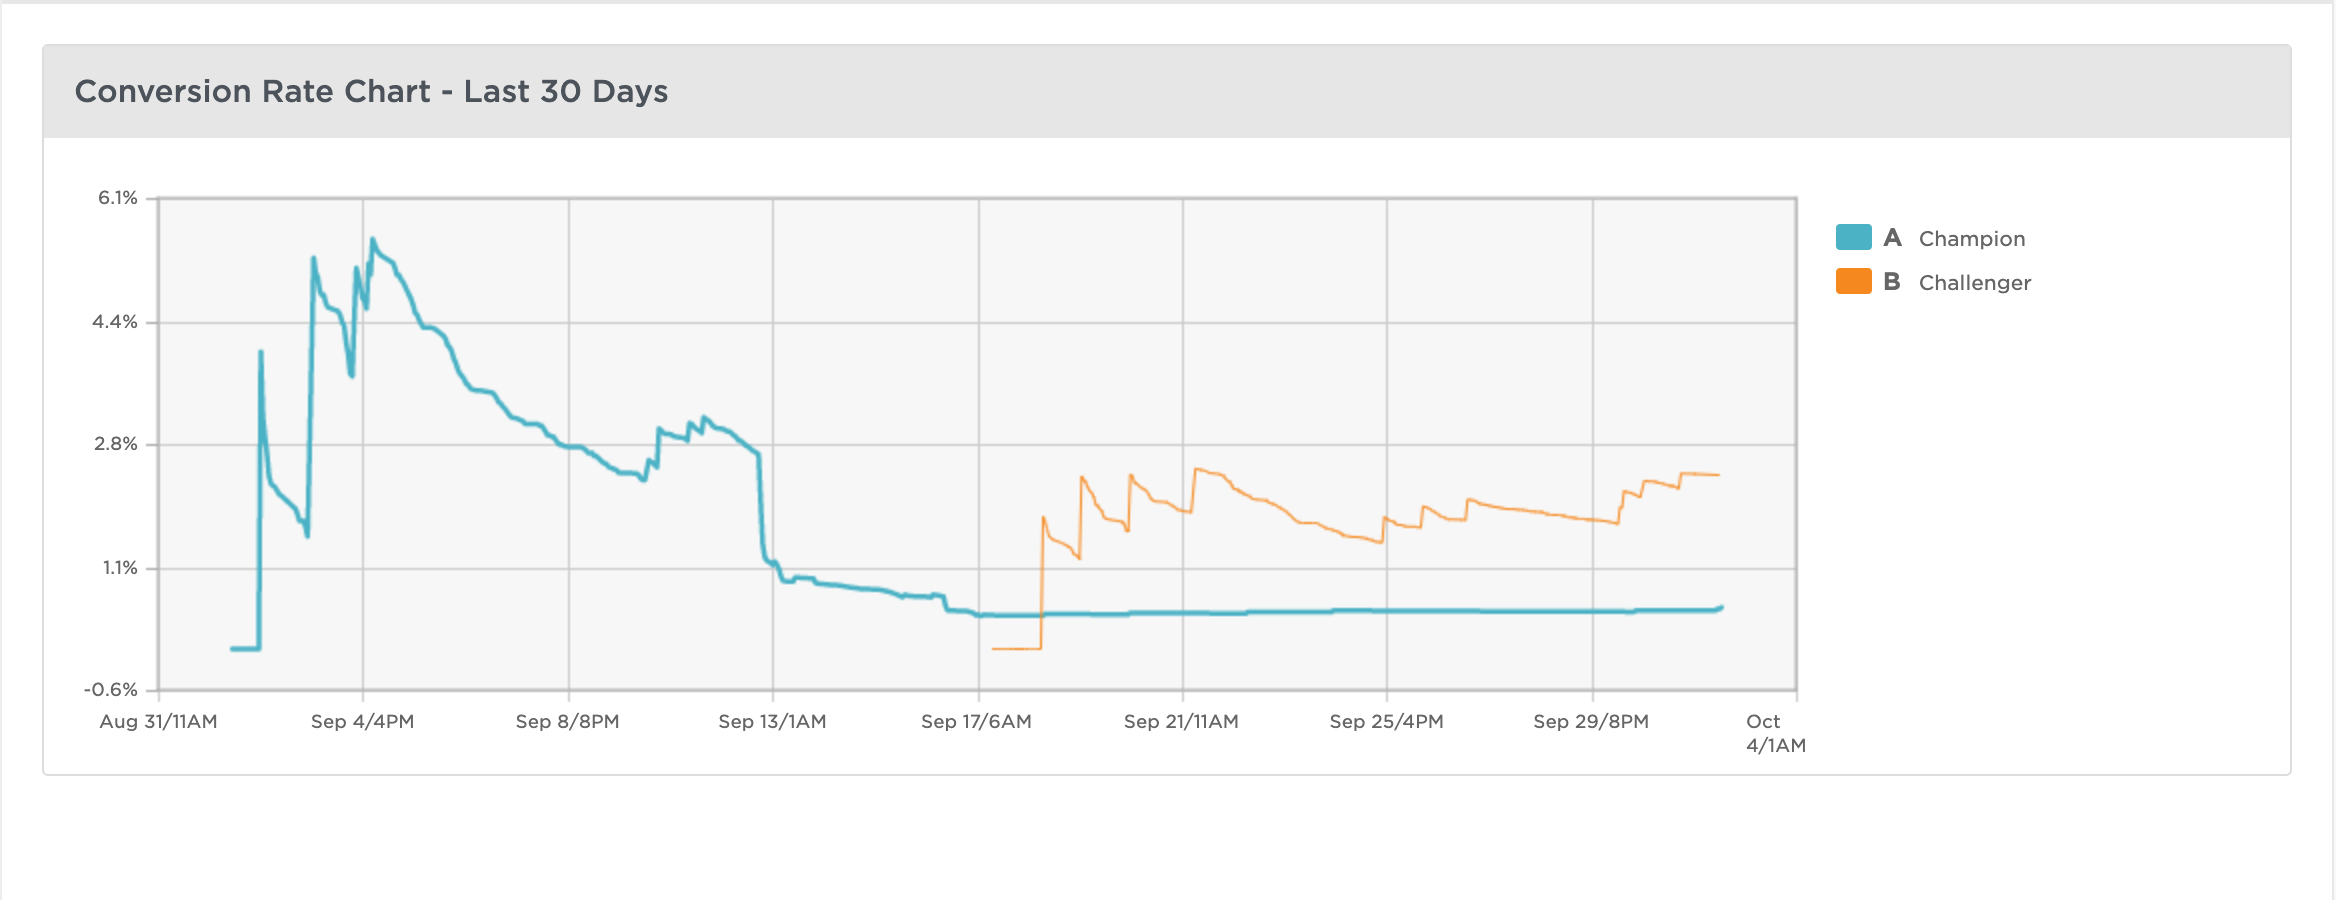
I’m trying to read our client landing page conversion rate chart, but i cannot understand why the champion line never seems to change. We can see a drop and a flattening of the conversion curve in conjunction with A/B test.
Any suggestions?
I attached conversion rate chart screen.
Thanks in advance.