Hi David. I would recommend always adding Google Analytics to your landing pages. This will give you the insight that you need 🙂
See the documentation to set it up here È
Thanks, we use GTM on all our pages to fire analytics and call tracking scripts.
I guess I should have been more specific in my question, It would be really helpful to see a breakdown at a glance in the conversion data in Unbounce. Our GA data is already dense enough with all the goals and events/actions we’re tracking.
Ok, good!
I would recommend setting up a view in GA to show only the traffic to your specific landing page. That way you can VERY easily drill down on all the good stuff for just that page 🙂
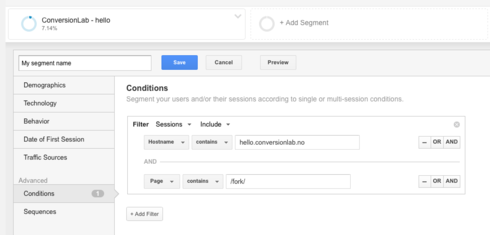
See below screenshot of a segment we set up for the page we have running on http://hello.conversionlab.no/fork
Hope this helps!

I think this would be a great feature in Unbounce. Just a breakdown within the page overview showing the traffic which hit the regular version of the page versus the mobile responsive version.
Of course, it is possible within Google Analytics, but what if variant A performs better on mobile, but variant B performs better on computers? Overall, when the variants are counted together, the page might perform evenly on both. Really I’d want to know whether to switch to a new variant consisting of the mobile variant from A but computer variant from B.
Hiya. I don’t think it’s realistic to have this kind of granularity within Unbounce withouth cluttering up the interface with too much info.
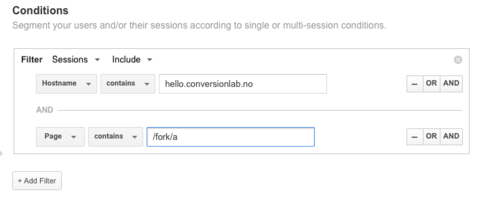
However you can easily do exactly what you describe by creating segments per page. Using the example above I have created a segment for variant A of the page. See attached.

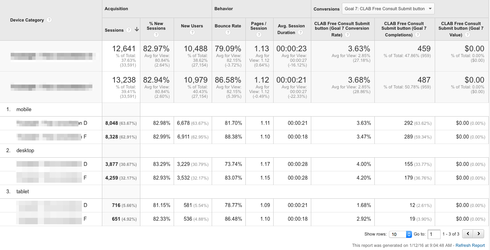
In your GA-report you can look under Audience/Mobile using your segments for both versions in your A/B test - and it will produce a report looking something like this

Make sure you use the built in GA integration for scripts to have variant letters passed to GA ;-)
Hope this helps!
I don’t honestly think one small additional column with a piece of very valuable data is “clutter”, especially if the sole purpose of the variant was to test changes to the mobile view, but if it was implemented in a similar way to how you can view segments in Adwords, then it wouldn’t be clutter at all - only visible if you choose to drill down by device segment, at which point it would show the additional two lines - Desktop, and Mobile & Tablet for each variant.
VWO gives the ability to do so in a graph, with the option to drill down by device segment among others, it’s a powerful addition that enables a quick decision from glancing the data without having to go to Analytics and view a segmentation report, then come back and act on the findings.
Having to create a whole page variation just to make a variation to the mobile view only is a bit clunky as it is, so having this data included in the conversion metrics would at least appease that a little.
Not everyone uses Google Analytics either, and it’s not always as straightforward to create a segmentation report in alternative analytics platforms.
I don’t think it is really much granularity and as Unbounce lets us create responsive pages, it would be great to see results of the responsiveness within Unbounce.
Hey all,
Just wanted to give a quick update: we absolutely want to provide a mobile/desktop breakdown of stats so that you can see how each is performing independently of each other. It’s at the top of the list for reporting/stats requests that we hear from lots of customers.
Carl (CTO) and myself did an AMA last week and talked about mobile/desktop reporting along with other plans for the roadmap in 2016. You can watch that recording over here…
The TL;DR for stats though is that we are in the process of re-building our stats platform to enable us to capture and surface many more events that are happening on the browser side, as opposed to server side (where our stats logging sits today.) Because the Mobile and Desktop versions of your page are triggered by the size of the browser, and not the actual device (part of being truly responsive) Ñ we need client-side stats logging before we can surface that data to you in the app, and this is exactly what one of our squads is working towards.
Finge’s GA solution is an excellent workaround for today (thanks Finge!) but we do want to make this data more accessible to you from within Unbounce.
Hope that helps!
Carter
Hi there! Are there any updates on this? I have a client asking about identifying conversions by device type.
Thanks!


